


A curated collection of modern, high-performance web dashboard samples built with pure client-side JavaScript using the MindFusion JavaScript Pack (JsPack).
This repository demonstrates how to integrate virtualized data grids, interactive data charts, executive KPI gauges, and diagramming controls into unified, real-time analytics consoles. All samples run entirely in the browser with zero backend dependencies, rendering datasets of 10,000+ rows smoothly at 60fps.
| Sample | Category | Key Components | Highlights |
|---|---|---|---|
| Operations Dashboard | Supply Chain / Inventory | DataViews (Grid), Charting (BarChart), Gauges (OvalGauge) | 10,000 live rows, multi-column sorting, inplace editing, category valuation chart, live fulfillment gauge |
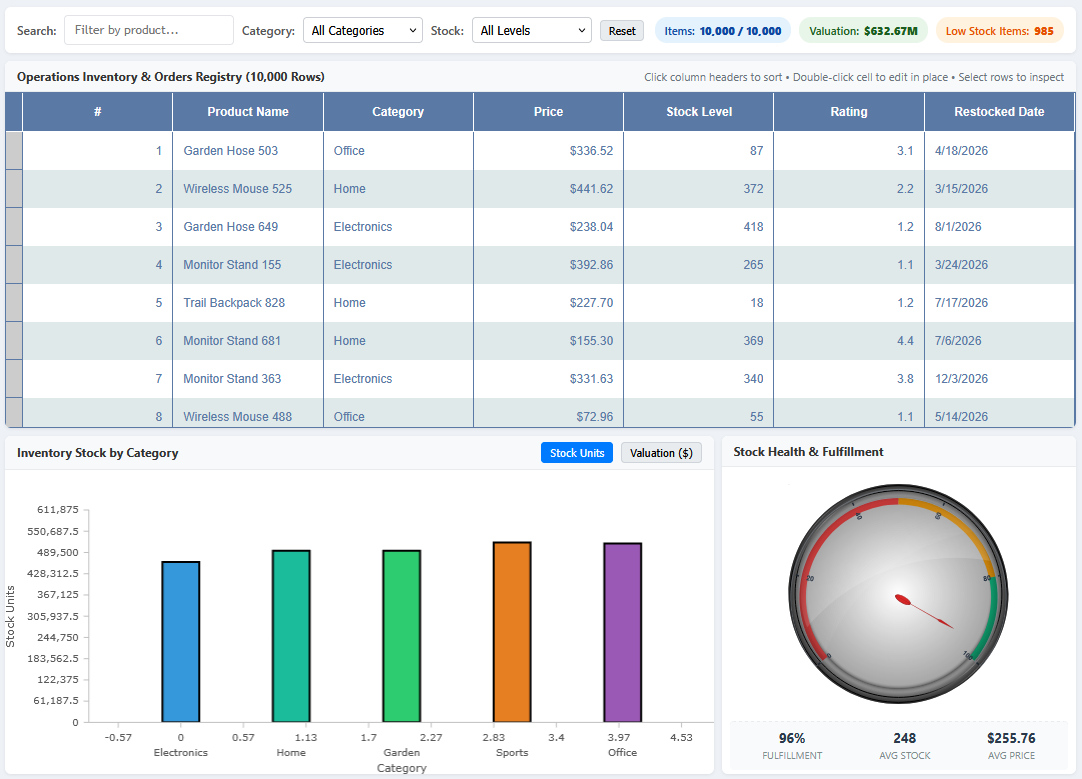
The Operations Dashboard (OperationsDashboard.html) demonstrates an executive command center for inventory management, warehouse stock levels, and order fulfillment tracking.
+--------------------------------------------------------------------------------+
|  SEARCH & FILTER TOOLBAR                                                       |
|  [Search product...]  [Category: All v]  [Stock: All v]  | 10k Items | $2.5M Val|
+--------------------------------------------------------------------------------+
|                                                                                |
|  MINDFUSION.DATAVIEWS (GRID) — 10,000 ROWS                                     |
|  #   Product Name        Category     Price     Stock    Rating   Restocked    |
|  ----------------------------------------------------------------------------  |
|  1   Garden Hose 503     Office       $336.52   87       3.1      04/17/2026   |
|  2   Desk Lamp 891       Electronics  $124.10   240      4.8      08/12/2026   |
|  ... (Virtual scrolling renders only visible viewport rows at 60fps)           |
|                                                                                |
+----------------------------------------------------+---------------------------+
|  MINDFUSION.CHARTING (BAR CHART)                   |  MINDFUSION.GAUGES        |
|  Inventory Stock & Valuation by Category           |  Fulfillment Health (KPI) |
|  [ Stock Units ]  [ Valuation ($) ]                |                           |
|                                                    |         /---\             |
|   |==|   |==|   |==|   |==|   |==|                 |       (  /85%\ )          |
|  Elect.  Home  Garden  Sports Office               |        \-------/          |
|  (Click a bar to filter grid to that category)     |  Fulfillment | Avg Stock  |
+----------------------------------------------------+---------------------------+
- High-Volume Virtualized Grid: Handles 10,000 generated records with DOM virtualization, keeping memory usage minimal and rendering lightning-fast.
- Multi-Column Sorting & Filtering: Instant search across text, numeric, and date fields using non-destructive functional predicates.
- Inline Inplace Editing: Full inline editing across data types (text inputs, dropdown menus, and datepickers).
- Dual-Metric Bar Chart: Instant toggle between physical inventory units and dollar valuations, with automatic headroom for labels and click-to-filter interaction.
- Operational KPI Dial: Oval gauge with color-coded operational zones (Critical, Warning, Optimal) tracking real-time fulfillment capacity.
- Bi-Directional Reactivity: Edits, row selections, or filter adjustments automatically propagate across the grid, chart, and gauge simultaneously.
All dashboard samples in this repository follow shared architectural principles:
Data can be generated on the fly (e.g., using lightweight PRNG algorithms like mulberry32) or loaded from client-side JSON files. No database or server setup is required to run the samples.
Data grids built with MindFusion.DataViews render only visible rows inside the viewport. Whether displaying 500 rows or 50,000 rows, scrolling remains responsive and fluid.
Dashboards use full-viewport flex column architectures (display: flex; flex-direction: column; height: 100%;) combined with dynamic canvas buffer synchronization (handleResize(), clientWidth/clientHeight), ensuring charts and gauges adapt to any screen resolution or aspect ratio without clipping.
Every component communicates through standard event dispatchers:
grid.rowSelected→ Highlights related data points on charts and gauges.grid.rowUpdated→ Recalculates aggregate metrics and refreshes visualizations in real time.chart.dataItemClicked→ Filters or drills down into grid records.
Because these dashboard samples are 100% pure client-side JavaScript, no Node.js build process, npm installs, or backend runtimes are required.
- Clone the repository:
git clone https://github.com/MindFusion/JavaScript-Dashboard-Samples.git cd JavaScript-Dashboard-Samples - Open the project folder in VS Code.
- Right-click any dashboard HTML file (e.g.,
OperationsDashboard.html) and double-click the HTML file.
# Python 3
python -m http.server 8080

# Node.js (npx)
npx serve .

# PHP
php -S localhost:8080
Open http://localhost:8080/OperationsDashboard.html in your browser.
MindFusion JavaScript Pack provides enterprise-grade UI components for complex data visualization and interaction:
- DataViews for JavaScript: High-speed virtualized data grids with sorting, filtering, editing, and grouping.
- Charting for JavaScript: Interactive bar, line, pie, radar, financial, area, and 3D charts.
- Gauges for JavaScript: Customizable circular, oval, and linear gauges with multi-scale dials and animated needles.
- Diagramming for JavaScript: Flowcharts, network diagrams, process trees, and schematic layouts.
- Scheduling for JavaScript: Interactive appointment calendars, resource planners, and timetables.
- Mapping for JavaScript: Geographic map controls with shapefile and tile layer support.
- Virtual Keyboard for JavaScript: On-screen touch and virtual keyboards for web applications.
- 🌐 MindFusion Website: mindfusion.dev
- 📦 Download Free Trial: MindFusion JsPack Download
- 📖 Documentation: JsPack Online Help & Guides
- 💬 Support Forum: Community Discussion Forum
- 📧 Contact Support: support@mindfusion.eu
These dashboard samples are provided under the MindFusion End User License Agreement. Free trial and evaluation versions of all MindFusion components are available for download.